Google Maps Popular Times: Ways Businesses Can Use the Data
“The goal is to transform data into information and information into insight.” – Carly Fiorina of HP
Since its start, Google’s goal has been to turn mounds of data into information that humans can actually use. One such transformation came in the form of user location data in Google Maps called Popular Times, in which Google displays the average foot traffic to a given location. While many in the press called this a great “line avoider” for consumers, the impact that this information can have on small businesses is phenomenal. However, to truly understand why this is important, we need to turn this “information into insight.” The remarkable thing is, with Popular Times, Google essentially gave you, the business owner, a crude, but free, store traffic counter.
Why Does My Business Traffic Matter?
There are a lot of reasons to have data on foot traffic, but businesses tend to use it to check store performance, holiday sale foot traffic, and for other promotion-measuring uses. Store traffic counters are much like web traffic monitoring tools like Google Analytics; they need to be installed before any analysis can be done. The really exciting (or creepy, depending on how you look at it) thing about Popular Times data is that Google has been storing location information from all of its Google Maps app users and has built graphs to show historical averages of the busy and slow times at a given location.
Understanding Google’s Popular Times Visit Data
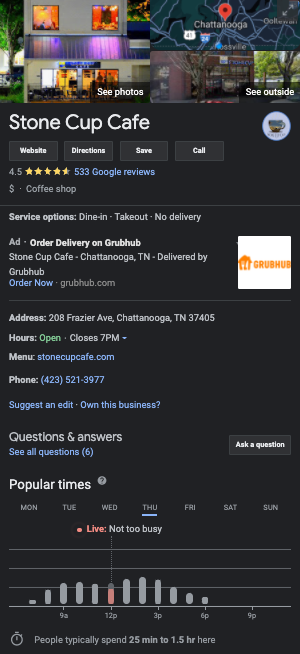
Let’s do a quick breakdown of what you might see while looking at Google’s Popular Times data. The popular times graph displays your busy times during different times of the day, Monday through Sunday. The live visit data tells you how active your location is in that given moment. Visit duration shows how long people tend to stay at your location based on previous customer visits in recent weeks. Some locations with a wait time — like a sit-down restaurant — will display an estimated wait time data based on patterns from different customer visits.
This basic bit of information can help local businesses with a range of decisions. For example, deciding to open later or close earlier can now be based on data other than purely sales numbers. However, there is more that can be deduced from the information available in the Popular Times historical data.
What to Should I Do with My Visit Data?
I looked at the Popular Times daily breakdown for Stone Cup Coffee (we love your coffee, guys!). Between 7am and 9am on Wednesdays and Thursdays, the traffic to the store is pretty steady, but when you compare that to the average traffic on a Monday or Tuesday, there seems to be about half as many visitors frequenting the location. One marketing idea to implement based on this information would be a discount or promotion on Mondays or Tuesdays between 7am and 9am to help boost sales from regular customers.
It will be interesting to see what other applications Google introduces using this stored anonymous user data. What possible uses could they conceivably have for it? Feel free to share your thoughts in the comments!