My Favorite Google Analytics Feature: Real-Time Reports

What if I told you that you could use Google Analytics to see what’s happening on your website right.this.very.minute? Well, you can with one of my favorite Google Analytics features, the Real-Time Reports. (Side note: I guess having a favorite analytics report officially makes me a nerd. Oh well.) So, why do I like them so much? You’re about to find out…
What Are the Real-Time Reports?
The Real-Time Reports in Google Analytics are a valuable way to get additional insights about your website and how visitors interact with it. As their name suggests, what makes the Real-Time Reports unique from other Google Analytics reports is that they show you what’s happening on your website as it happens. So, if you catch a visitor on the reports, you can actually see what they’re doing as they move through your website.
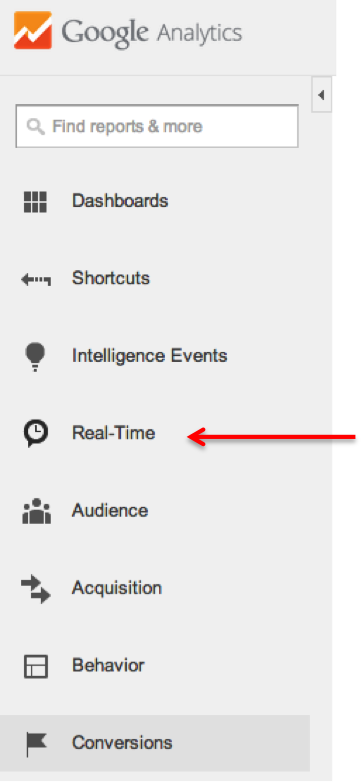
The Real-Time Reports are found in the left-hand menu just under Intelligence Events in Google Analytics.
The reports themselves are divided into six sections: Overview, Locations, Traffic Sources, Content, Events, and Conversions.
Overview:
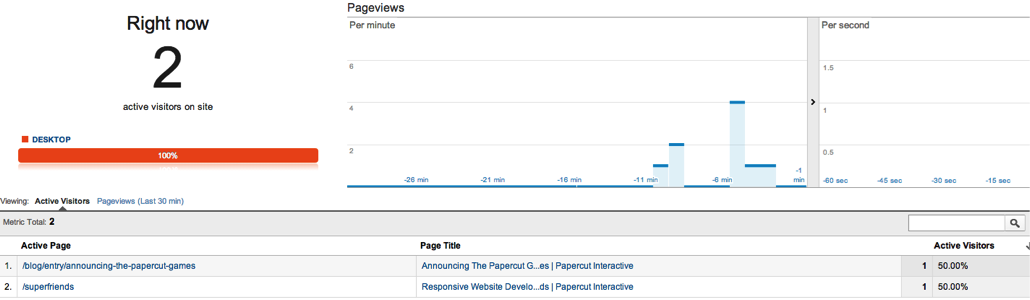
This is the report I look at the most often, as it provides a quick snapshot of all the important real-time information I want to know. The report looks something like this:
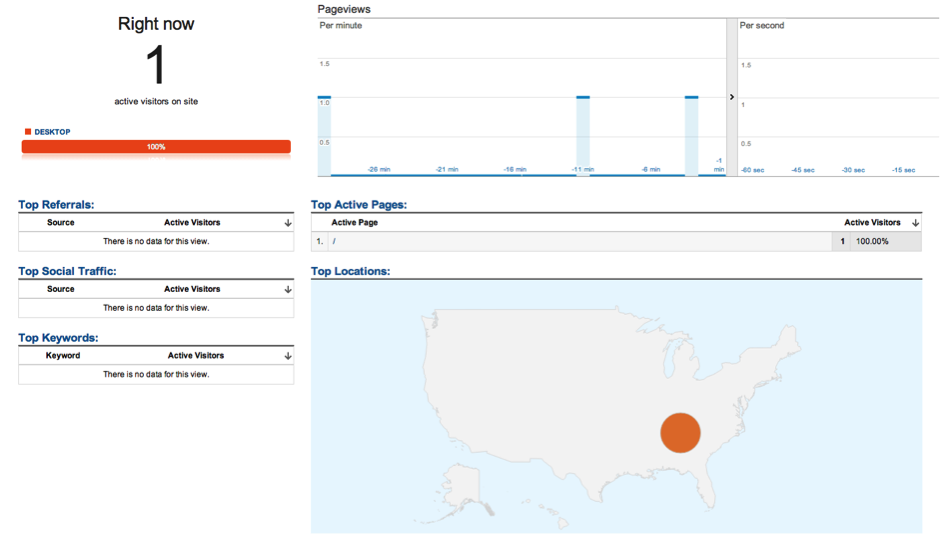
As you can see, when there’s a visitor on the site, a number displays along with a colored bar to show what type of device is being used (desktop, mobile, or tablet). You can also see the top referral and social traffic sources, as well as the keyword(s) that sent visitors coming from organic search. More often than not, this is (not provided), but every once in a while, you’ll catch an actual keyword that you can use to help in your on-site optimization efforts. All of these keywords will also be listed in your Organic Keywords Report, but it’s kind of neat to catch them as the visitor is on your site.
The right side of the Overview Report shows you pageviews per minute and the active pages on your site, as well as the total number of visitors on each page. There’s also a handy little map to show you the geographical location of each visitor. If you mouse over the circle, the city will display.
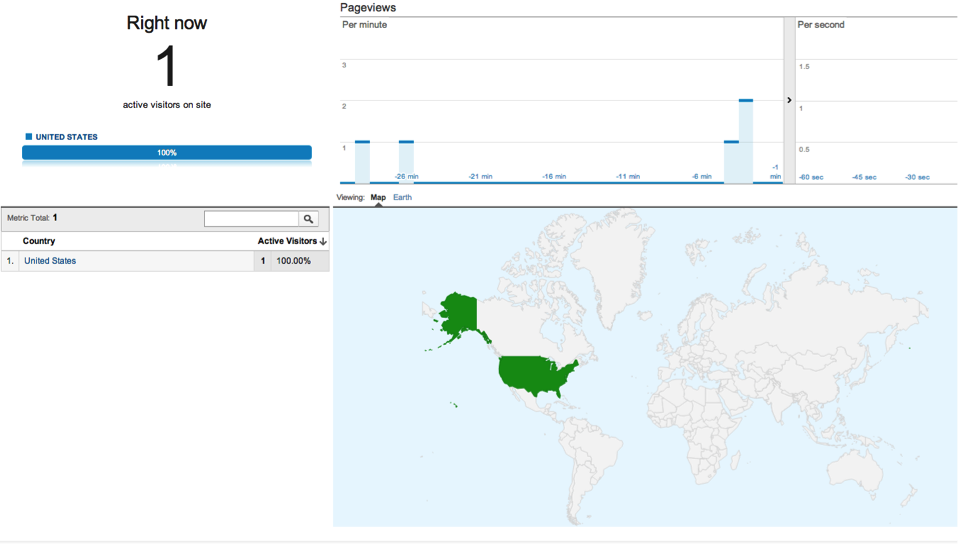
Locations:
The layout of the locations report is very similar, but it only displays the country where current visitors are located and the pageviews per minute:
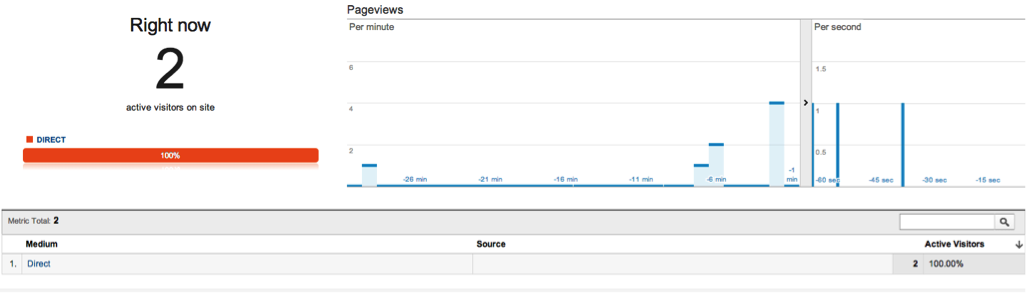
Traffic Sources:
This report will show you how your active visitors are getting to your website. It displays the number of visitors with a color-coded bar to indicate whether they arrived directly or through organic traffic, social media, or even a campaign.
Content:
The Content Report shows which pages active visitors are currently viewing and the number of visitors on each.
Events and Conversions:
I’ve lumped these last two together because they really have a similar function. If you have events or goals set up in your analytics account, you can click on one of these reports to view the number of active visitors that have completed each desired action, such as clicking on a button or filling out a form.
The Content, Events, and Conversions Reports will also display data for the last 30 minutes, so if you miss something as it happens, you still have a chance to view some recent activity on your site.
How Can You Use These Reports?
- Checking to see if new content is being viewed – If you’ve just added a new page to your website, published a new blog post, or launched a new product, you can use the Real Time Reports to see if people are actually looking at it. In the case of the Papercut website, I look at these reports every time we publish a new post on the blog. Yes, I’m watching you… Just kidding (not really). We routinely promote our blog content on our social media accounts, and I use the Google URL builder to create a tracking URL to add to our social posts. The parameters in this URL allow Google to collect additional data. When I create this special URL, I’m also creating a campaign (typically with the same name as the blog post) that categorizes traffic using this link in my analytics data. So, when a person is reading one of our blog posts, I can see if they arrived on our site through a Facebook post or a tweet. Pretty cool, right? Of course, you’ll also be able to see if they’ve found your new content directly or through a referral site, a PPC campaign, or organic search.
- Troubleshooting – Think there might be an issue with your Google Analytics tracking code implementation? The Real-Time Reports can help you figure it out. If your data doesn’t look right, try visiting your website from different computers and devices (or even browsers) and see if the reports pick you up as a visitor. Just make sure you don’t have a filter set up to remove traffic from your IP address, or this won’t work. If you’re visiting the site on your iPhone and two different computers and you aren’t showing up on these reports, something is probably up, and it’s time to consult with your developers. This is a handy trick to have up your sleeve if you’re going through a site redesign or if you’re adding a page to your website. Make sure your tracking code is working properly so your website (and analytics) can work for you!
- They’re fun – Okay, so this isn’t really a reason why these reports are useful, but it’s true. It’s neat to see where your visitors are coming from and what they’re looking at when it happens. On Wednesday, I was looking at the analytics on Ashley’s Crossfit post, and I noticed that someone in the Czech Republic was reading it. I know she has family there, so it was probably them. Pretty cool, right? I think so.
Don’t Overlook Them
When you log into Google Analytics, you’re automatically sent to the Audience reports, which are located below the Real-Time Reports. If you don’t use the Real-Time Reports regularly, it’s easy to overlook them or forget that they’re there—but don’t! You’ll miss out on some useful insights if you do.